Debugging
Development is fraught with testing and bugs.
We want to make this as fast and easy as possible, so let's take a look at Kristal's Debugging Tools.
Getting Started
Before we get into each debugging tool, we need to make sure they're all enabled. Head over to Kristal's main menu and open up the options.
We're looking for a toggle called "Debug Hotkeys" - it should be under the Engine tab (the last one on the list). Make sure it's set to ON.
This has enabled Debug Hotkeys. (cue fanfare)
We'll get to what those are in a moment.
One more thing.
While you're still in settings, head over to the Keyboard Controls. Scroll down until you see these four:
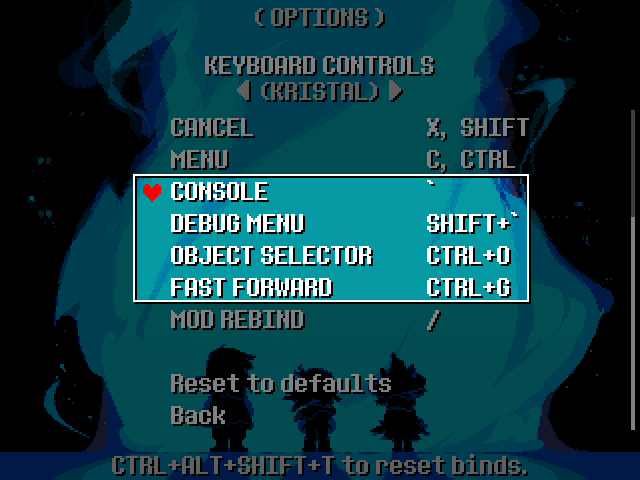
These are the default binds for the other debug tools we'll be using.
Be mindful of the ` (backtick) some of these binds use. It looks close to an ' (apostrophe), even if it isn't. Make sure not to mix them up!
Debug Hotkeys
Hey! That's those things we enabled before!
Debug Hotkeys are fairly straightforward. Press some keys, and something happens. That something is generally going to help your testing go faster, like giving full heals, TP restoration, or, quite literally, speeding up the game.
Here's the full list of the debug keys and what they do:
Ctrl+Rquicksaves the game and then reloads your project. You'll load back to whatever world/map and state you were in previously.Ctrl+Shift+Rreloads the game without quicksaving. You'll load in from when you last saved.Ctrl+Alt+Rreloads the game from a new file.Ctrl+Mpauses/resumes the in-game music.Ctrl+Ntoggles noclip.Ctrl+G(Fast Forward Keybind) toggles fast-forward.Ctrl+Hheals your party to full.Ctrl+Kfully restores TP.Ctrl+Bkills you instantly.
These two hotkeys only have functionality in battle:
Ctrl+Fends all active waves.Ctrl+Ywins the battle immediately.
These hotkeys use function keys - on some devices, you'll need to use Ctrl or Fn with these for Kristal to see the input.
F2toggles fast-forward.F3opens this website!F4enables fullscreen.F6enables Debug Rendering.
The Debug Menu
Here's where the fun part of Debugging begins!
Press Ctrl+` (or your Debug Menu keybind) to open up the debug menu. It should appear as an overlay on the game window:
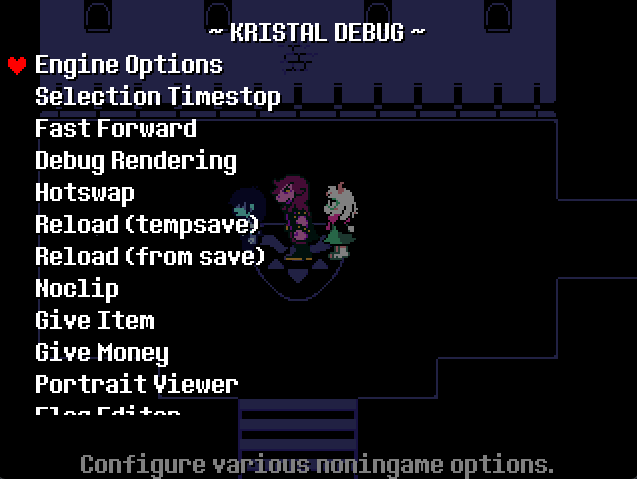
There's a lot of options and sub-menus within here! At the bottom of the screen you'll see a short description of what the currently selected option does.
Many of the features toggled by debug hotkeys also appear here too!
Some of the engine settings appear in Engine Options, like framerate options and the FPS display toggle.
It's a good idea to test multiple framerates with this to ensure that your fangame will run the same across framerates and therefore for all your players. (Testing just 30fps and 60fps is enough to make it clear whether your code is frame-independent.)
The other options in this menu are a collection of handy features for debugging and testing. Have a play around with them!
Of course, there are also world and battle exclusive menus too. Make sure to check out the debug menu in both to harness its full potential!
Debug Rendering
A feature of the debug menu is Debug Rendering. (Well, not really. It's also a debug hotkey.)
The main focus of debug rendering is showing collision, plus we get state and hotkey information in battles:
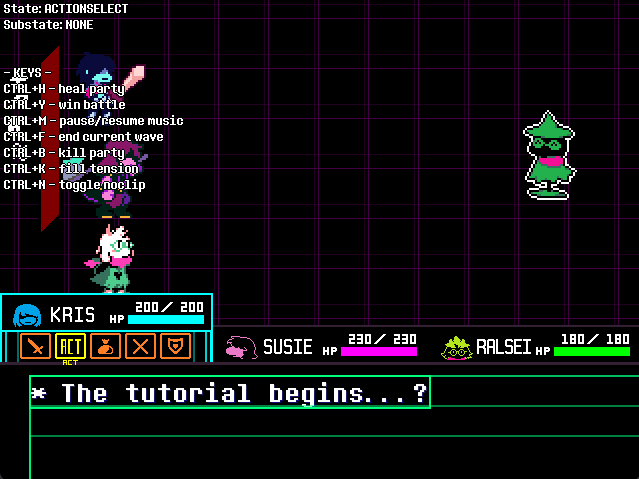
This alone is useful, but it's information can also help you debug in ways you might not have considered.
Most objects that exist have some kind of collision. This includes objects we can't usually see, like a lot of events.
With Debug Rendering, we can see these otherwise unseen objects by their collision:
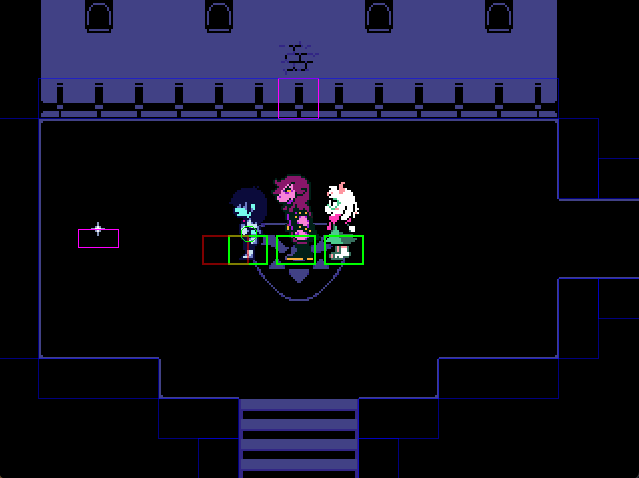
Events (World objects) show as pink. If we can't see a pink outline where an event is placed, that indicates some kind of loading issue.
On the other hand, if the hitbox is there, then we rule out the problem being a loading issue, and know that the issue relates to the object functioning.
Narrowing down the problem like this makes it easier to trace your bugs to their source and squash them. Never underestimate the power of a bunch of colourful shape outlines!
If you want to draw your own things for the debug renderer, you can check the DEBUG_RENDER global in any draw code to conditionally draw debugging information.
Custom Debug Menus
If you're making something fairly complex, you may also want to consider making your own debug menu entries.
You can do that in Mod:registerDebugOptions(debug) in your mod.lua.
(TODO: There's no dedicated guide for this yet... If you need this, you'll hopefully be confident enough to learn by reading debugsystem.lua in the source code in the meantime...)
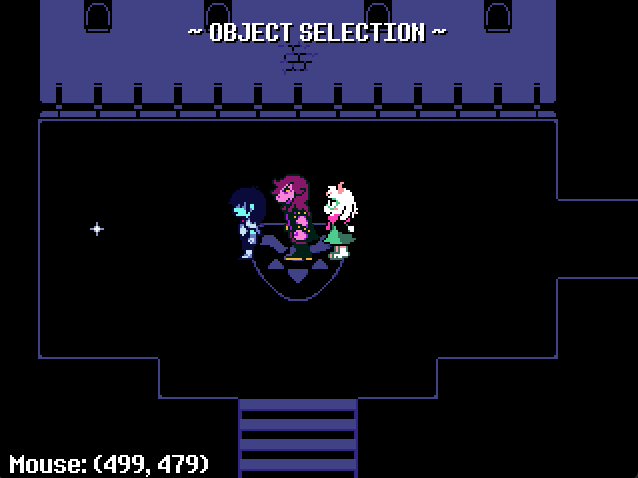
The Object Selector
The Object Selector selects objects. Why? Well, for a lot of reasons, actually!
To toggle the object selector, hit Ctrl+O (Or your Object Selection keybind). You should see some text appear on the screen to confirm the object selector is active:
While using the object selector, you can choose whether to have the game play behind it or not.
When you were in the debug menu, you probably saw Selection Timestop. That option is the one that controls this behaviour.
You'll probably want to keep the game running behind the Object Selector most of the time, but pausing will come in handy for temporary or fast moving, small objects, so don't forget about it!
From the Object Selector, you can use the mouse cursor to select objects.
You'll be able to see the debug rectangles (not hitboxes!) of everything you hover over and what Class they are.
Click something and...
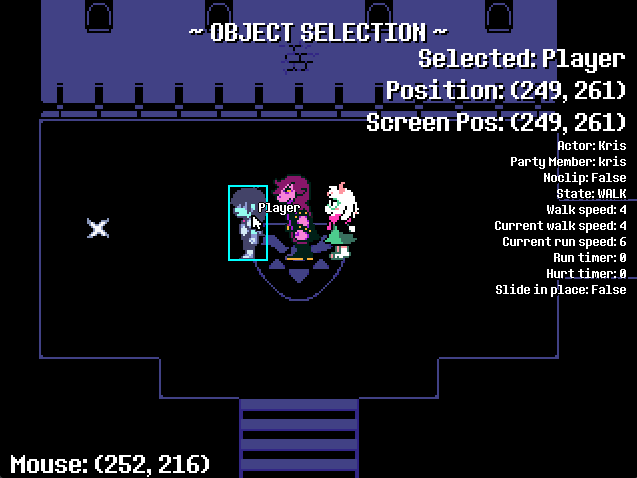
Loads of information! Let's break it down.
First we have the "Selected" display. This is a repeat of what we already know from hovering - the Class of the selected object.
Next is the x and y co-ordinate of this object's origin, relative to it's parent.
This is directly followed by its screen position, which is relative to the top-left corner of the game window*.
(* Not including the border or any window scaling. The game window is always treated as 640x480.)
The rest of the data here is Debug Info.
You might have seen a method called getDebugInfo() on a lot of objects - this is what it's for!
This is everything that gets printed out by the Player object in it's getDebugInfo. We can check the source code to confirm that:
function Player:getDebugInfo()
    local info = super.getDebugInfo(self) -- (Player's parent classes also have debug information to show - this line lets it use them)
    table.insert(info, "State: " .. self.state_manager.state)
    table.insert(info, "Walk speed: " .. self:getBaseWalkSpeed())
    table.insert(info, "Current walk speed: " .. self:getCurrentSpeed(false))
    table.insert(info, "Current run speed: " .. self:getCurrentSpeed(true))
    table.insert(info, "Run timer: " .. self.run_timer)
    table.insert(info, "Hurt timer: " .. self.hurt_timer)
    table.insert(info, "Slide in place: " .. (self.slide_in_place and "True" or "False"))
    return info
end
As a developer, you'll probably want to add debug information to many of your own objects as well.
In their files, you can also define the getDebugInfo() function. There's no tricks with this one, so using the Player implementation as an example should be straightforward.
While you're accomodating for the object selector, you may want to know how to change an object's Debug rectangle. These are hitboxes used specifically for the object selector.
This is a quick add to each object's init() function if the default debug rectangle ever causes an issue:
self.debug_rect = { x, y, width, height } -- Replace these with whatever shape you want for your debug rectangle
You can also move objects around freely by dragging them. This can be useful, but more importantly it's also very fun:
Also try right-clicking an object! You'll get a little context menu with a few other helpful tools. Try some of them out! Especially that one.
There are also some other options if you right-click anywhere else on the screen.
If you can't find your object or it lacks a debug rectangle, using "Select Object" here is a great way to find it instead.
The Console
This is the last of the main debugging features in Kristal.
The console is the most flexible debug tool. Access it with the Console keybind, which is `.
You should see the console appear over your game window:
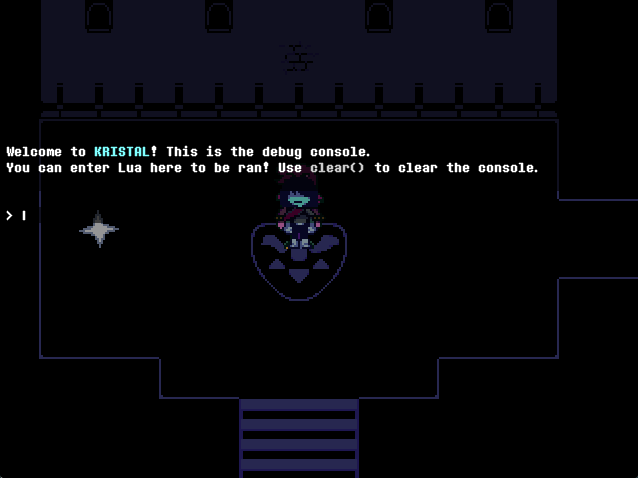
The console runs code. If you type something in and hit Enter, it gets run right away:
You can write and run code quickly in the console to test things. Just beware that you'll need to rely on Game a lot because it's one of the few useful globals you have access to in this context.
If you write something that errors directly, the console will spit it out without crashing the game.
Another handy feature is the =value syntax. If you start an input with =, then it will print the value next to it as an output:
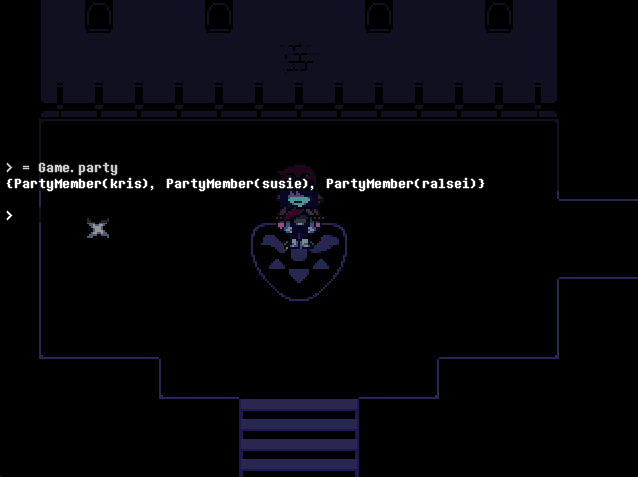
This is great for quickly checking calculations or variable values.
Not having quick access to objects and always needing to use Game is annoying. What if we could fix that?
Huh!?
That's right - the object selected by the object selector is accessible through the console. An _ underscore or the word selected can be used to reference the current selection.
This interaction makes it much easier to quickly check variables and run code on objects.
Afterword
That's all of the awesome debug features built-in to Kristal!
Of course, these alone can't solve all your problems, but they'll make the process a lot easier!
If you're still stuck on an issue, the best place to turn is always the engine's community!
You'll find everyone over on the Kristal Discord (link at the top of this website!), and can drop any modding issues in the #dev-help forum there.